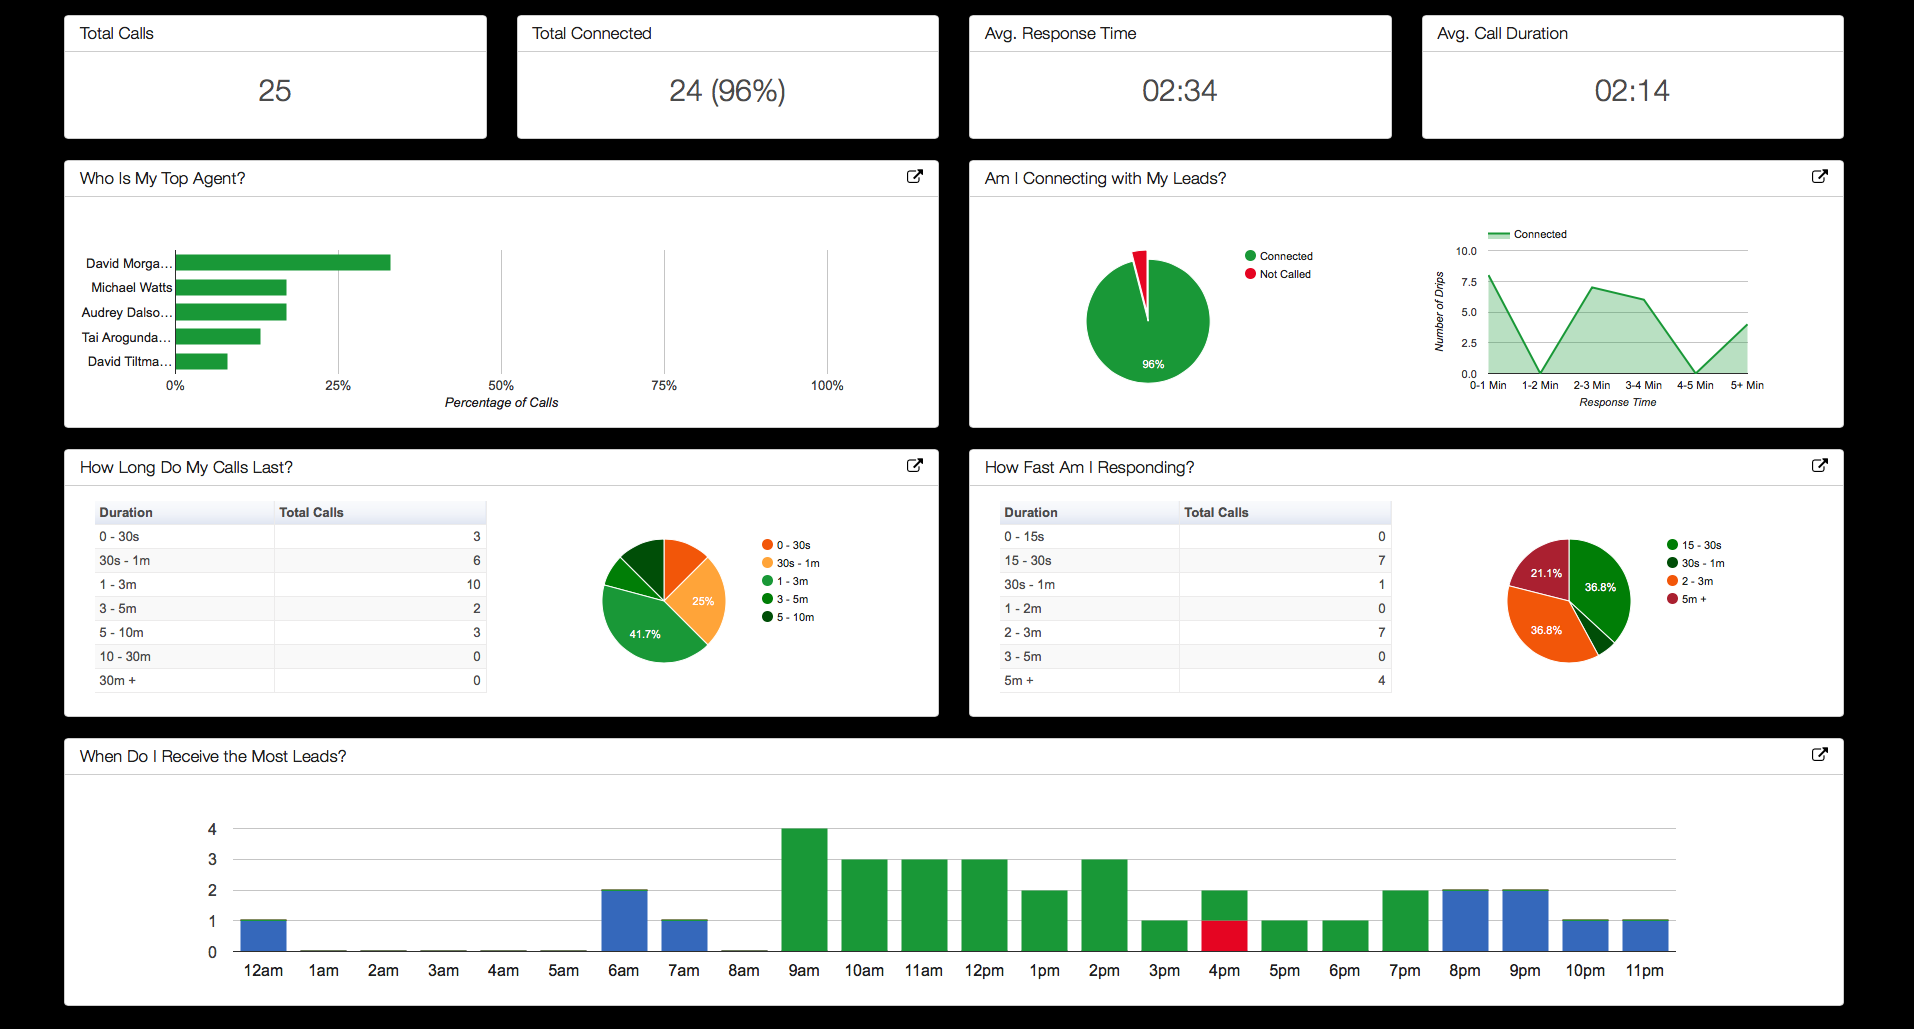
Reports Overview
Calldrip allows you to view data about your leads, customers, and agents to make the best decisions for your business.
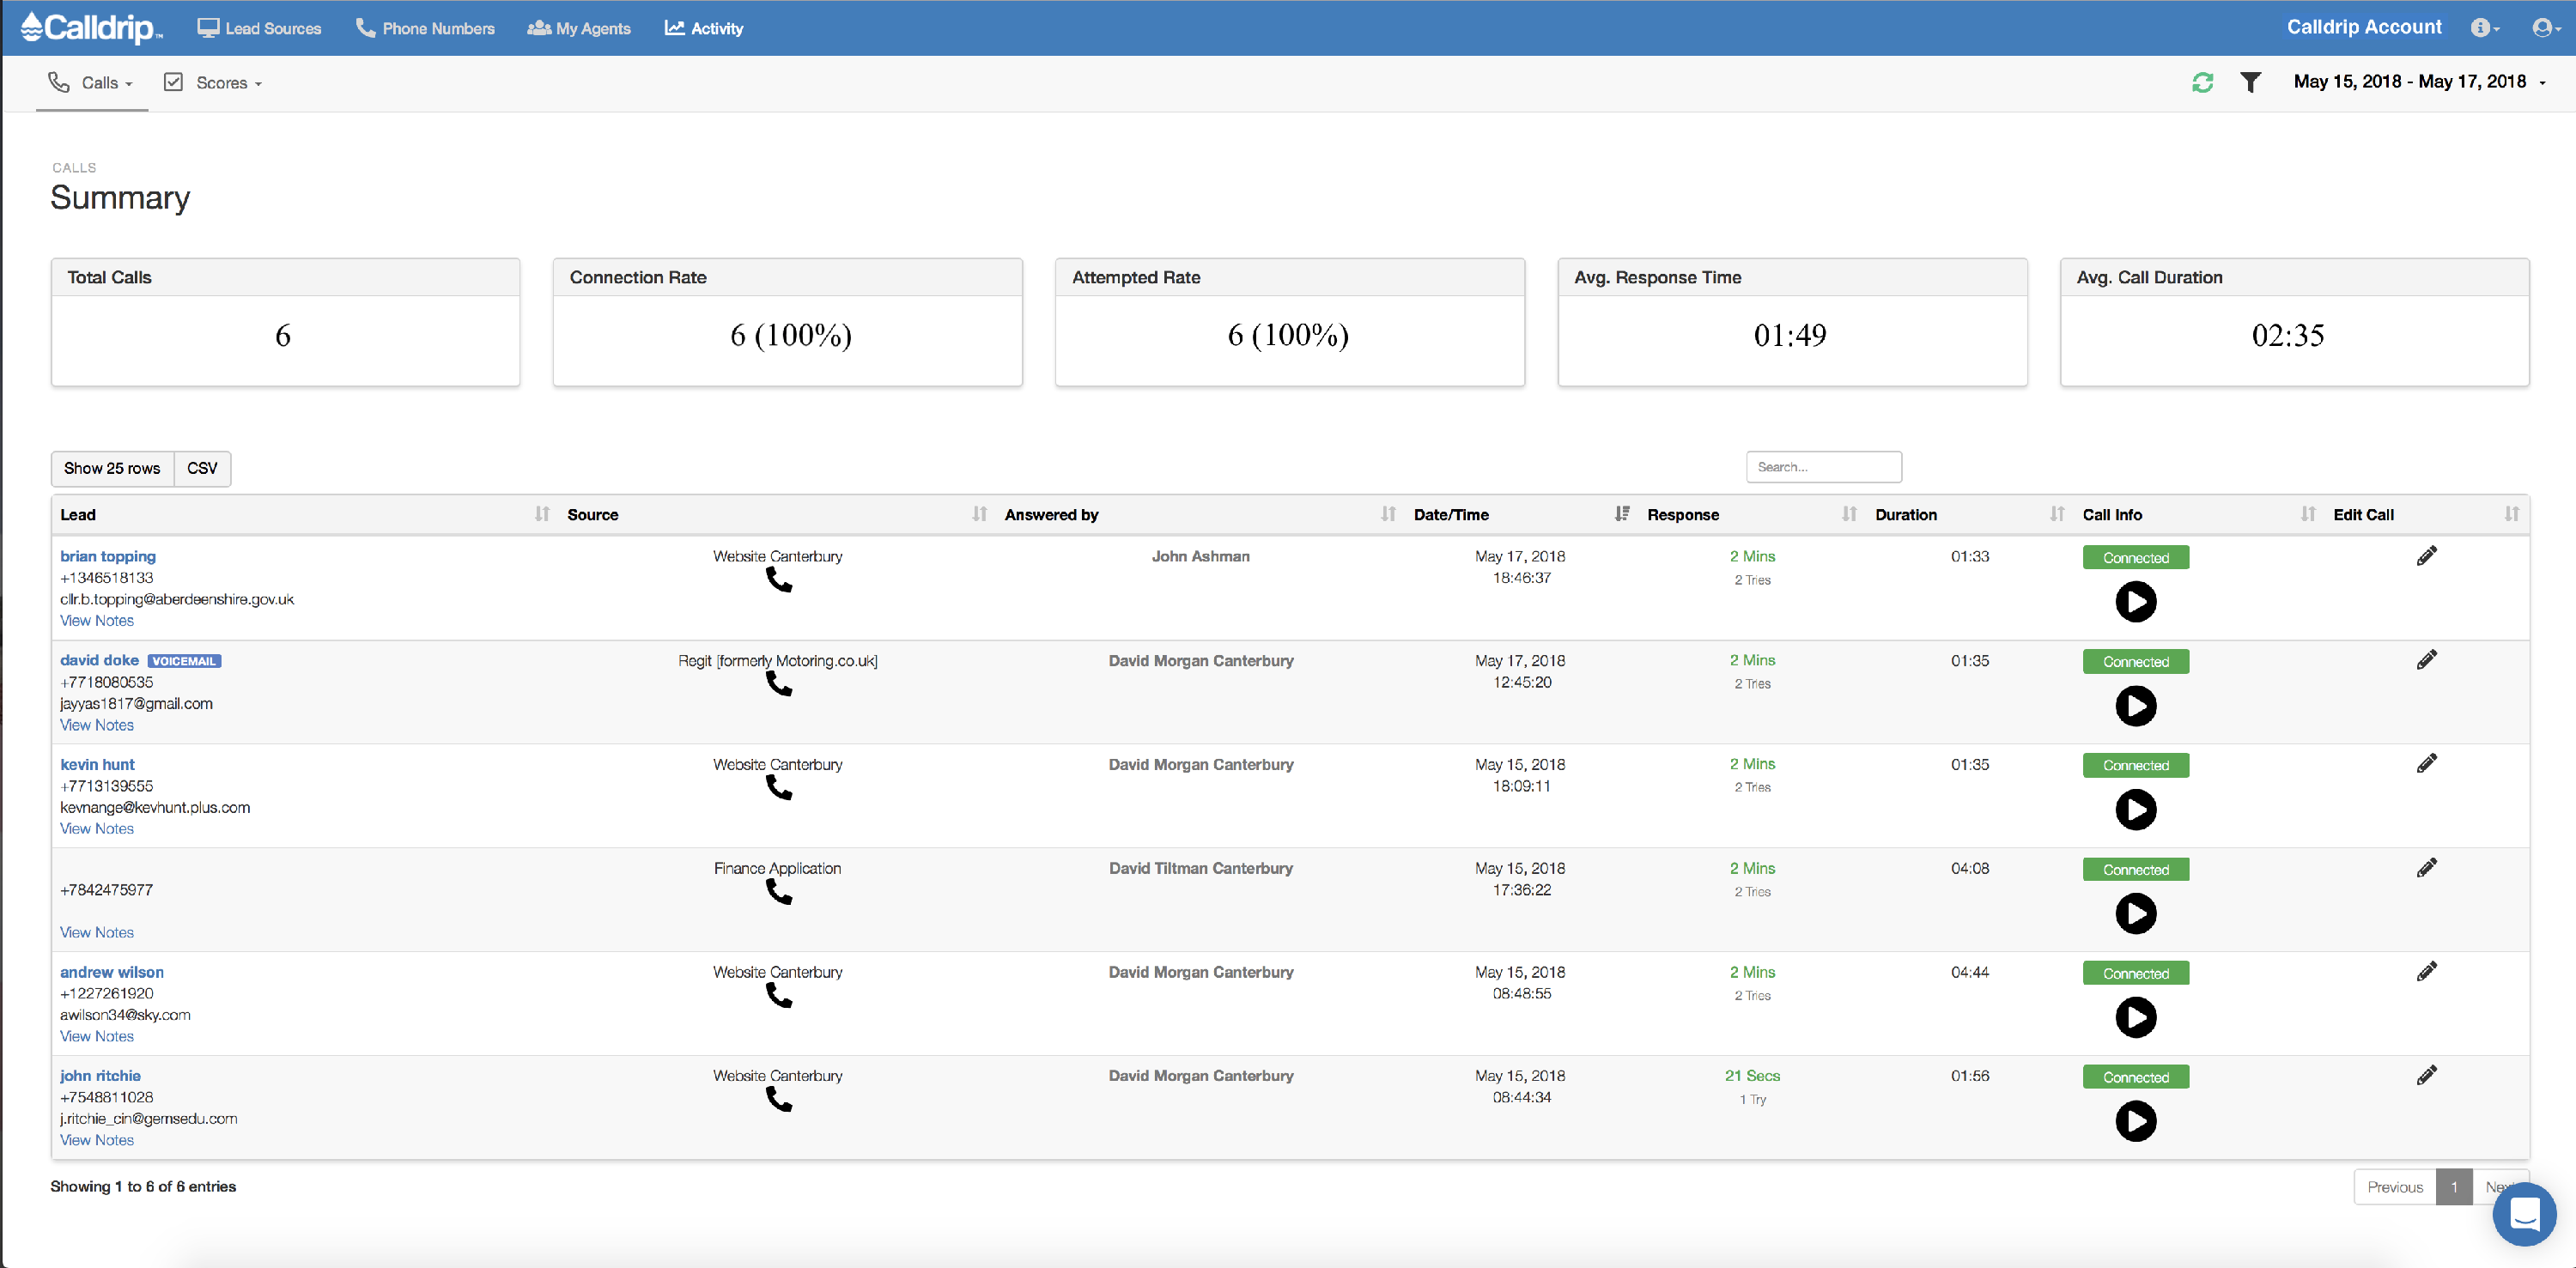
This is Calls Summary. Here you can view Total Calls, Connection Rate, Average Response Time, and Average Call Duration.
The table below shows contact information about the Customer, the Source the lead came from, the Sales Agent who took the call, Date/Time, Call Duration, and Call Info.
 This will display if the number was not called. This is usually because nobody was able to answer the call.

The agent hung up their phone before the customer answered their phone. *Customer may not have had a voicemail setup, number is disconnected or no longer in service.
 This will display if a Sales Agent connects to the customer. This will also display if the Sales Agent is connected to the Customers Voice mail.

This will display if a second lead is delivered to Calldrip with the same phone number as a previous lead.

This will display if the customers line is busy.

This will display when each active agent is after hours.
 This will display if the number doesn't exist.
 This will display when the Sales Agent is talking to the Customer.
Calls Dashboard
This is the Dashboard to view data about Calls, Agents, Leads, Speed, and Time.
Here you can quickly visualize valuable information like
- Total calls
- Total connected calls
- Average Response Time
- Average call duration
- Who are the top performing Agents
- What percentage of Leads are connecting
- Duration of phone calls
- Response time
- Peak Hours
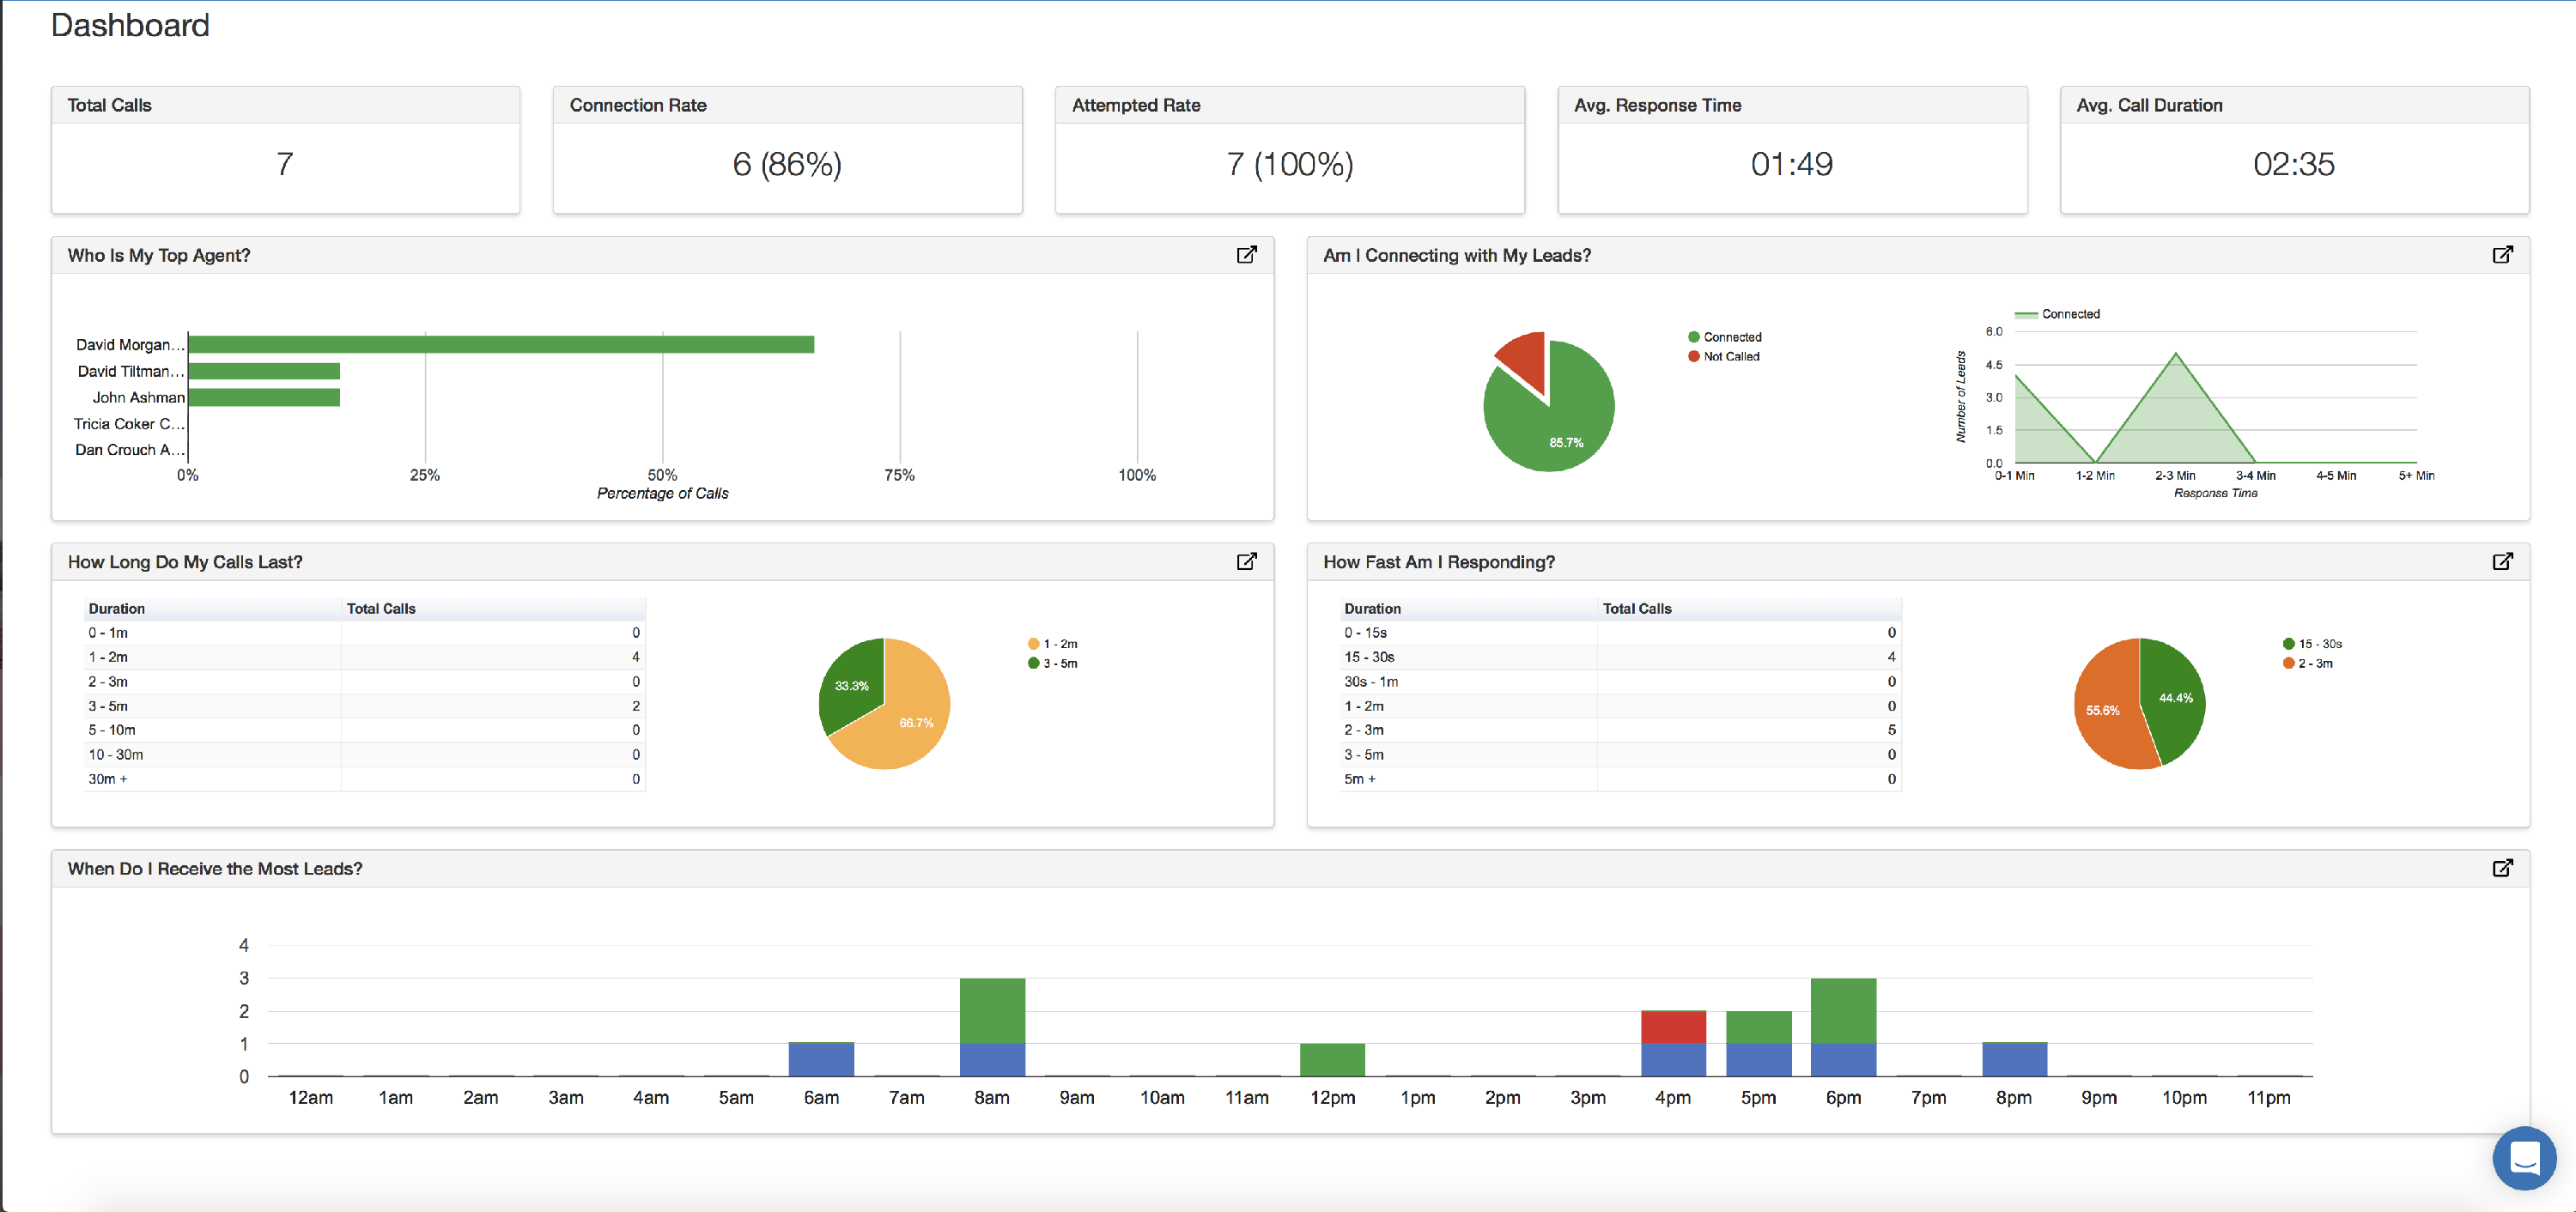
 Click on this icon to expand each section to get more data about each category.
Scores
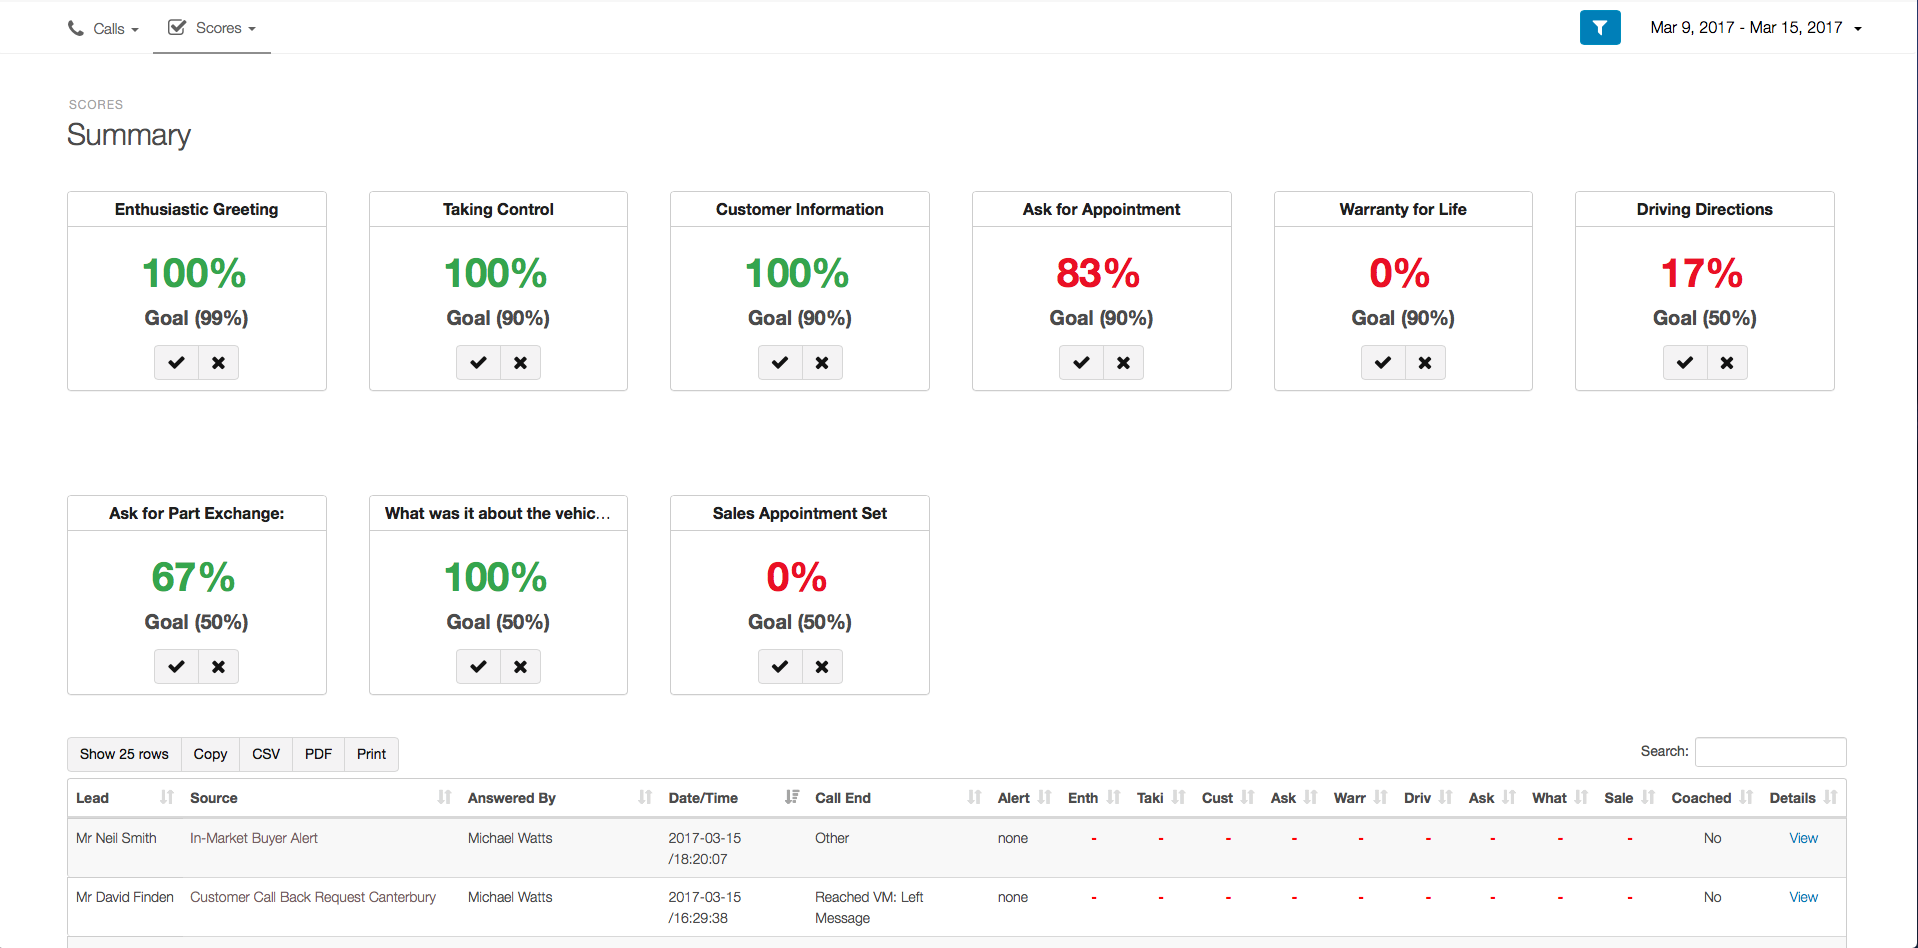 Here you can find an easy to view Summary of Scores. Every category is 100% customizable!
Scores Dashboard
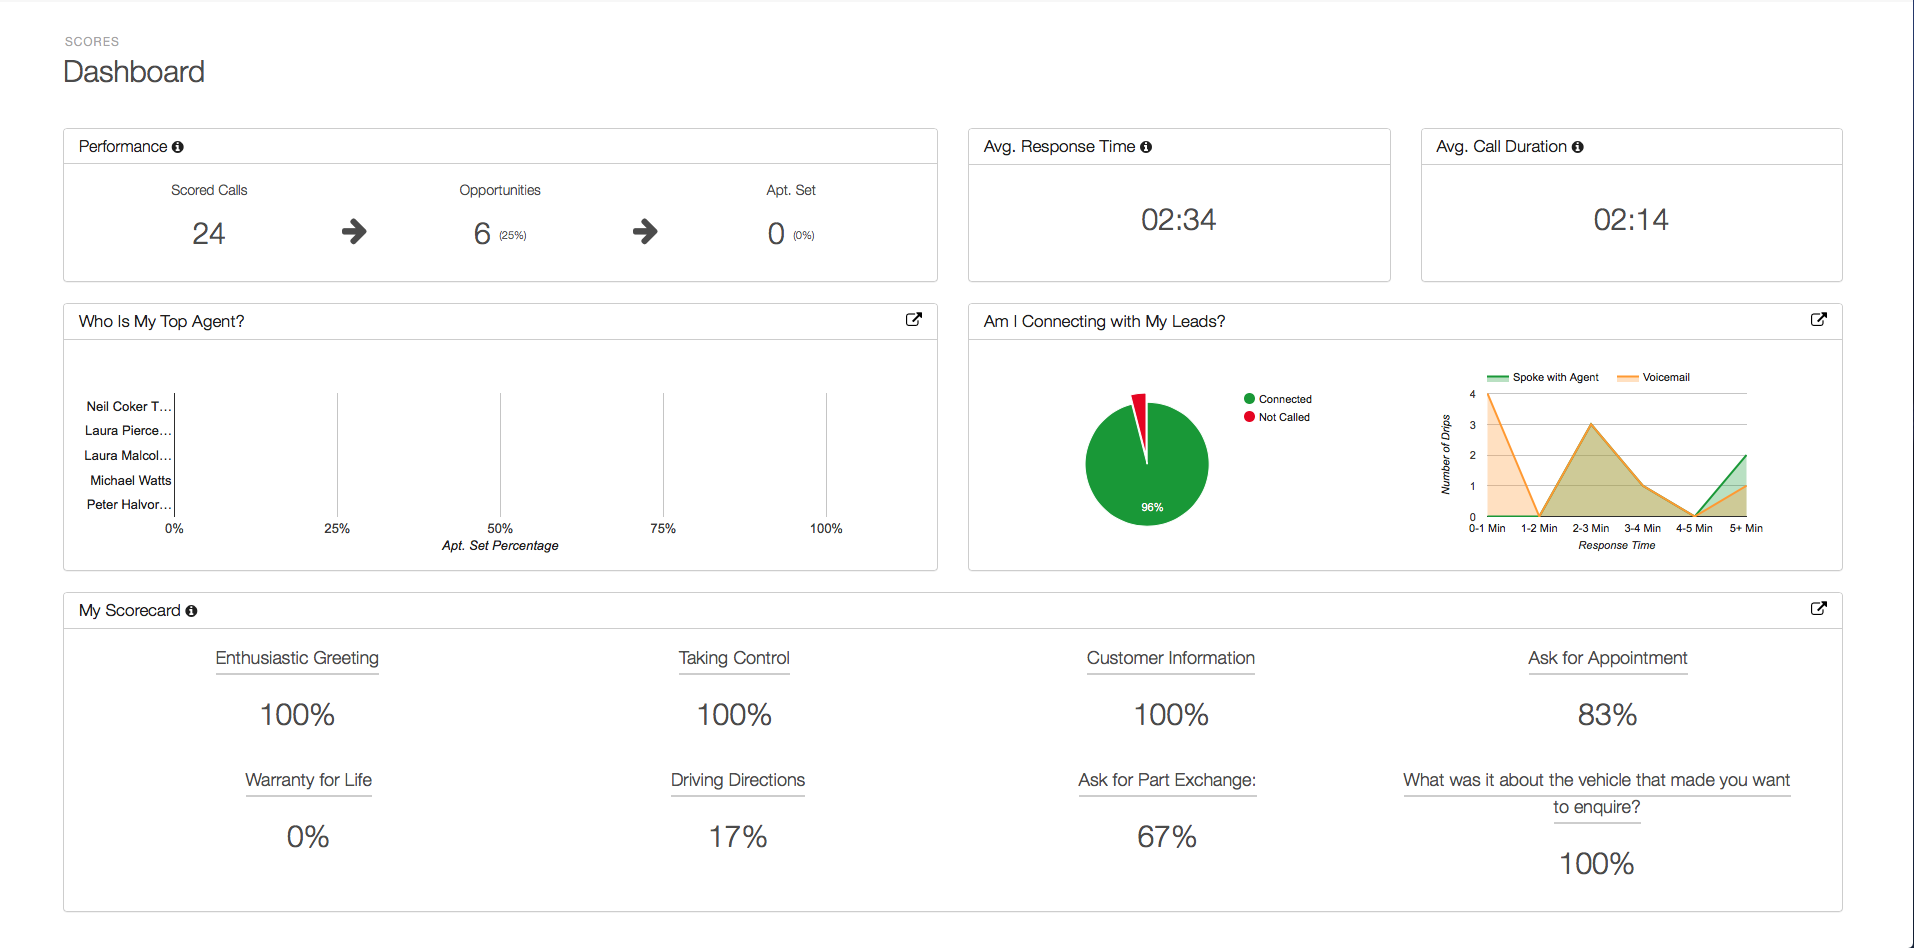
This data is pulled from Scored Calls. Here you can view Performance, Time, Duration, Agent information, and Scorecard.
 Click this icon located on the top right to enter Display Mode. Here you will get live stats updating in real time. This will look great on any display size or dimensions.